Wireshark is a free, open-source network protocol analyzer that captures live traffic and decodes it from the physical layer up to application-layer protocols like HTTP, DNS, and TLS. Getting useful output from it takes five steps: install Wireshark, select your active network interface, start a short capture, apply a display filter like dns or http, and click a packet to inspect its details. Three filters you can use immediately: display filter dns to see all DNS queries and responses, capture filter port 53 to record only DNS traffic from the start, and display filter http.request to isolate outbound HTTP requests. One non-negotiable rule applies before any of this: capture only on networks and devices you are authorized to inspect.
Key Takeaways
Wireshark is the industry-standard, free packet analyzer for network troubleshooting and security analysis, and short captures with focused display filters are the fastest path to useful results.
| Point | Details |
|---|---|
| Use official downloads only | Get Wireshark from wireshark.org; Windows requires Npcap, which the official installer bundles. |
| Start with simple display filters | Filters like dns, http.request, and tcp.analysis.retransmission isolate relevant traffic immediately. |
| Capture filters vs display filters | Capture filters (BPF) exclude traffic permanently; display filters are non-destructive and applied after capture. |
| Use statistics panels first | Protocol Hierarchy, Endpoints, and Conversations give a diagnostic overview before you inspect individual packets. |
| Totalcyber accelerates the path | Instructor-led labs with curated scenarios and live mentoring move learners from basics to career-ready skills faster than self-study alone. |
Table of Contents
- What are the Wireshark basics every beginner should know?
- How do you download and install Wireshark on Windows, macOS, and Linux?
- How do you start your first live capture in Wireshark?
- What is the difference between capture filters and display filters?
- How do you read a packet in Wireshark’s three panes?
- Which built-in statistics panels give you the fastest diagnostic picture?
- How do you save, open, and export capture files, and when should you use tshark?
- What are the most common beginner mistakes, and how do you fix them?
- What is a practical lab path for building Wireshark proficiency?
- Why Wireshark is the career skill most beginners underestimate
- Hands-on labs that accelerate your Wireshark learning curve
- Sources
What are the Wireshark basics every beginner should know?
Wireshark reads every packet crossing a network interface and decodes it into human-readable fields. That single capability covers a wide range of practical tasks.
Common use cases:
- Troubleshooting broken or slow connections by watching TCP handshakes and retransmissions
- Debugging DNS resolution failures by checking whether a query ever gets a response
- Analyzing HTTP request/response cycles for web application issues
- Learning how protocols like TCP, UDP, ARP, and ICMP actually behave in practice
- Reviewing forensic capture files during security investigations
- Measuring performance by examining packet timing and payload sizes
Wireshark has real limits, though. Encrypted TLS traffic shows up as ciphertext, not plaintext, so you see that a connection exists but not its content unless you load a session key log. On switched networks, you only see traffic destined for your own host by default; capturing other hosts’ traffic requires a managed switch with port mirroring or a network tap. Permission and legal boundaries matter just as much as technical ones: capturing traffic on a network you do not own or administer without explicit written authorization is illegal in most jurisdictions.
Pro Tip: Start every session with a specific question, such as “Did the DNS query for example.com return an answer?” rather than opening a capture and staring at thousands of packets. A focused question leads to a focused filter, and a focused filter leads to an answer in minutes rather than hours.
Responsible use of packet capture tools is a professional obligation. Pairing your Wireshark practice with a formal IT ethics certification gives you a documented understanding of the boundaries that employers and clients expect you to respect.
How do you download and install Wireshark on Windows, macOS, and Linux?
Download the official installer exclusively from wireshark.org. Third-party mirrors introduce risk; the official package is signed and includes the correct driver bundles for each platform.
Windows
The Windows installer bundles Npcap, the packet capture driver Wireshark requires to access network interfaces. During installation, accept the Npcap component when prompted. If Npcap is missing or outdated, Wireshark will open but list no interfaces. Run the installer as an administrator, and after installation, restart the machine if the installer requests it. Updating Wireshark later is straightforward: download the new installer and run it; it replaces the previous version and updates Npcap if a newer version is bundled.
macOS
Download the .dmg from the official site. After installation, Wireshark requires access to /dev/bpf* devices to capture packets. The installer includes a utility called ChmodBPF that grants your user account capture access without requiring you to run Wireshark as root. If the interfaces list appears empty after install, open a terminal and verify that ChmodBPF ran correctly, or add your user to the access_bpf group manually.
Linux
Most distributions provide Wireshark through their package manager. On Debian or Ubuntu, sudo apt install wireshark works. During installation, the installer asks whether non-root users should be able to capture packets; select yes. Then add your user to the wireshark group with sudo usermod -aG wireshark $USER and log out and back in. Running Wireshark as root is possible but not recommended for daily use, since a vulnerability in a dissector could be exploited with elevated privileges.
Common installer issues: If no interfaces appear, the capture driver is either missing (Windows: reinstall Npcap; Linux: check group membership; macOS: run ChmodBPF). If Wireshark crashes on launch, check that the installed version matches your OS version and that no conflicting older version remains.
How do you start your first live capture in Wireshark?
Selecting the right interface is the single step beginners most often get wrong. Wireshark lists every network adapter on the machine, including virtual adapters, loopback interfaces, and VPN tunnels. The active interface shows a live activity graph next to its name; pick the one with visible traffic spikes.
- Open Wireshark. The welcome screen lists all available interfaces with real-time traffic sparklines.
- Double-click the active interface. For most laptops, this is the Wi-Fi adapter (often labeled
en0on macOS orWi-Fion Windows). For wired connections, select the Ethernet adapter. - Reproduce the activity you want to capture. Open a browser, run a ping, or trigger the application behavior you are investigating. Keep the capture short, ideally 30–60 seconds for a first session.
- Stop the capture. Click the red square stop button in the toolbar, or press
Ctrl+E(Windows/Linux) orCmd+E(macOS). - Save the capture file. Go to File → Save As, and choose the
.pcapngformat. This preserves interface metadata and timestamps for later review.
Optional capture filters can limit what the engine records from the start. For example, entering port 80 in the capture filter bar before starting records only HTTP traffic. This reduces file size on busy networks, though it also means you cannot go back and look at other traffic types later.
Pro Tip: On a noisy corporate or home network, use Wireshark’s ring-buffer feature under Capture → Options → Output to write captures in rotating files of a fixed size (e.g., 10 MB per file, keeping the last five). This prevents a runaway capture from filling your disk.
If a capture shows zero packets, check three things in order: confirm you selected the correct interface, verify the capture driver is installed and your user has capture permissions, and confirm that network activity is actually occurring on that interface during the capture window.
What is the difference between capture filters and display filters?
Capture filters and display filters solve different problems and use entirely different syntax. Mixing them up is one of the most common beginner mistakes.
Capture filters use Berkeley Packet Filter (BPF) syntax and are applied before any packet is written to disk. They are fast and efficient, but they are permanent: traffic excluded by a capture filter is gone and cannot be recovered from the capture file. Display filters use Wireshark’s own expression syntax and are applied after capture, letting you show or hide packets from an existing capture file without deleting anything.
| Capture Filters | Display Filters | |
|---|---|---|
| When applied | At capture time (before writing) | After capture (non-destructive) |
| Syntax | BPF (tcpdump-style) | Wireshark expression syntax |
| Effect | Permanently excludes traffic | Hides/shows packets; data stays |
| Example | port 53 |
dns |
| Example | host |
ip.addr |
| Example | tcp port 80 |
http.request |
Copy/paste display filter snippets for common troubleshooting:
dns— shows all DNS queries and responseshttp.request— shows outbound HTTP requests onlytcp.analysis.retransmission— surfaces TCP retransmissions, a key indicator of packet lossarp— isolates ARP traffic to identify broadcast storms or IP conflictsip.addr == 10.0.0.5— filters all traffic to or from a specific IP addresstcp.port == 443— shows all TLS/HTTPS connections
The general workflow: capture broadly when you are unsure what you are looking for, then use display filters to narrow the view. If you already know exactly what protocol or host you need, a capture filter keeps the file manageable.
Pro Tip: Right-click any field in the Packet Details pane and select “Apply as Filter → Selected” to instantly build a display filter from a real packet value. This is faster and more accurate than typing filter expressions by hand.
How do you read a packet in Wireshark’s three panes?
The Wireshark User’s Guide describes three panes that together give you a complete picture of any packet. Learning to move between them deliberately is the core skill of packet analysis.
The three panes:
- Packet List (top pane): One row per packet. Columns show the packet number, timestamp, source and destination addresses, protocol, length, and an Info summary. The Info column is often enough to answer simple questions without opening the other panes.
- Packet Details (middle pane): A collapsible protocol tree. Each layer of the packet, from Ethernet frame to IP header to TCP segment to application payload, appears as an expandable node. Click any field to highlight the corresponding bytes in the Packet Bytes pane.
- Packet Bytes (bottom pane): The raw hexadecimal and ASCII representation of the packet. Useful for verifying exact byte values or reading unencrypted payloads directly.
Key fields to check first: source and destination IP addresses, source and destination ports, the protocol label, TCP flags (SYN, ACK, FIN, RST), and sequence/acknowledgment numbers for TCP streams.
Follow TCP Stream is one of the most powerful actions available. Right-click any TCP packet in a conversation and select “Follow → TCP Stream.” Wireshark reassembles the entire conversation and displays it as readable text, with client data in one color and server data in another. For an HTTP session, you see the full request headers, response headers, and body in one view.

Other useful right-click actions include “Decode As” (force Wireshark to interpret a port as a specific protocol), “Export Packet Bytes” (save raw payload data), and “Mark/Unmark Packet” (flag packets for later reference).
Pro Tip: Pick one complete TCP conversation from a capture and trace it from SYN to FIN using Follow TCP Stream before trying to analyze the full capture. Understanding one conversation end-to-end builds the mental model you need for everything else.
Which built-in statistics panels give you the fastest diagnostic picture?
Wireshark’s Statistics menu contains several panels that compress an entire capture into a diagnostic summary. These are faster than scrolling through individual packets when you need to understand traffic patterns at a glance.
Protocol Hierarchy (Statistics → Protocol Hierarchy) shows the percentage of traffic by protocol, layered by encapsulation. If you see an unexpected protocol consuming significant bandwidth, or a protocol that should not be present on the network at all, this panel surfaces it immediately.
Endpoints (Statistics → Endpoints) lists every unique IP address, MAC address, or port that appears in the capture, along with packet counts and byte totals. Sorting by bytes sent or received identifies top talkers quickly.
Conversations (Statistics → Conversations) pairs endpoints into source-destination flows and shows packet counts, byte totals, and duration for each. This is the right starting point when you suspect one host is generating excessive traffic or when you need to find which two hosts are communicating on a specific port.
I/O Graphs (Statistics → I/O Graph) plots packet rate or byte rate over time. Spikes in the graph correlate with bursts of activity; flat lines during a period when traffic was expected indicate a connection failure or timeout. You can overlay multiple display filters on the same graph to compare, for example, total traffic versus retransmissions.
Flow Graph (Statistics → Flow Graph) renders a ladder diagram of a conversation, showing the sequence of packets between two or more hosts in time order. It is particularly clear for visualizing TCP handshakes and application-layer exchanges.
A practical workflow: open Protocol Hierarchy first to understand what is in the capture, then open Conversations to find the top-traffic flows, then right-click a conversation and select “Apply as Filter” to isolate it, and finally use Follow TCP Stream to read the exchange.
How do you save, open, and export capture files, and when should you use tshark?
Wireshark supports two primary capture file formats. The older .pcap format is widely compatible with third-party tools and older analysis platforms. The newer .pcapng (pcap Next Generation) format preserves additional metadata, including interface names, capture timestamps with nanosecond precision, comments, and packet annotations. For new captures, .pcapng is the better choice; use .pcap only when sharing with a tool that does not support pcapng.
Saving is straightforward: File → Save As, choose the format, and name the file. To save only a subset of packets, apply a display filter first, then use File → Export Specified Packets and select “Displayed” to write only the visible packets to a new file. Wireshark also supports merging multiple capture files through File → Merge.
When sharing captures with colleagues or submitting them for review, remove sensitive data. Capture files can contain credentials, session tokens, and private keys transmitted in cleartext. The User’s Guide documents export options that let you strip or redact specific fields before sharing.
tshark is Wireshark’s command-line counterpart, useful for scripted or headless captures where a GUI is unavailable. A basic tshark capture command looks like this:
tshark -i eth0 -w capture.pcapng -a duration:60
This captures on interface eth0, writes to capture.pcapng, and stops automatically after 60 seconds. tshark also supports display filters and can output decoded fields directly to a terminal or a CSV file, making it practical for automated log collection and pipeline integration.
What are the most common beginner mistakes, and how do you fix them?
Most Wireshark problems trace back to a small set of errors. Recognizing them early saves significant time.
Common mistakes and fixes:
- No packets appear: You selected the wrong interface, the capture driver is not installed (Windows: missing Npcap; Linux: user not in
wiresharkgroup), or no traffic is flowing on that interface. Verify the interface sparkline shows activity before starting. - Applying a display filter syntax as a capture filter:
dnsis a valid display filter but not a valid BPF capture filter. The capture filter bar turns red when the syntax is wrong; the display filter bar turns green for valid expressions. - Expecting plaintext from encrypted traffic: TLS traffic appears as encrypted application data. Decryption requires a pre-master secret log file or session keys exported from the browser or application.
- Capturing everything and finding nothing useful: A 500 MB capture file with no filter applied is difficult to analyze. Start with a focused question, apply a display filter immediately, and use the statistics panels to orient yourself.
- Capturing on the loopback interface: Loopback (
loorLoopback Pseudo-Interface) only shows traffic between processes on the same machine. For network traffic, select the physical or Wi-Fi adapter.
Quick troubleshooting checklist before assuming Wireshark is broken:
- Confirm the correct interface is selected and shows live traffic sparklines.
- Verify capture driver installation (Npcap on Windows, group membership on Linux).
- Check that no capture filter is blocking the traffic you expect.
- Reproduce the network activity while the capture is running, not before or after.
- Apply a display filter to isolate the protocol you are looking for.
Pro Tip: Keep captures under two minutes when learning. Short, focused captures with a single reproduced action are far easier to analyze than long, noisy ones. Reproduce the exact behavior once, stop the capture, and filter immediately.
What is a practical lab path for building Wireshark proficiency?
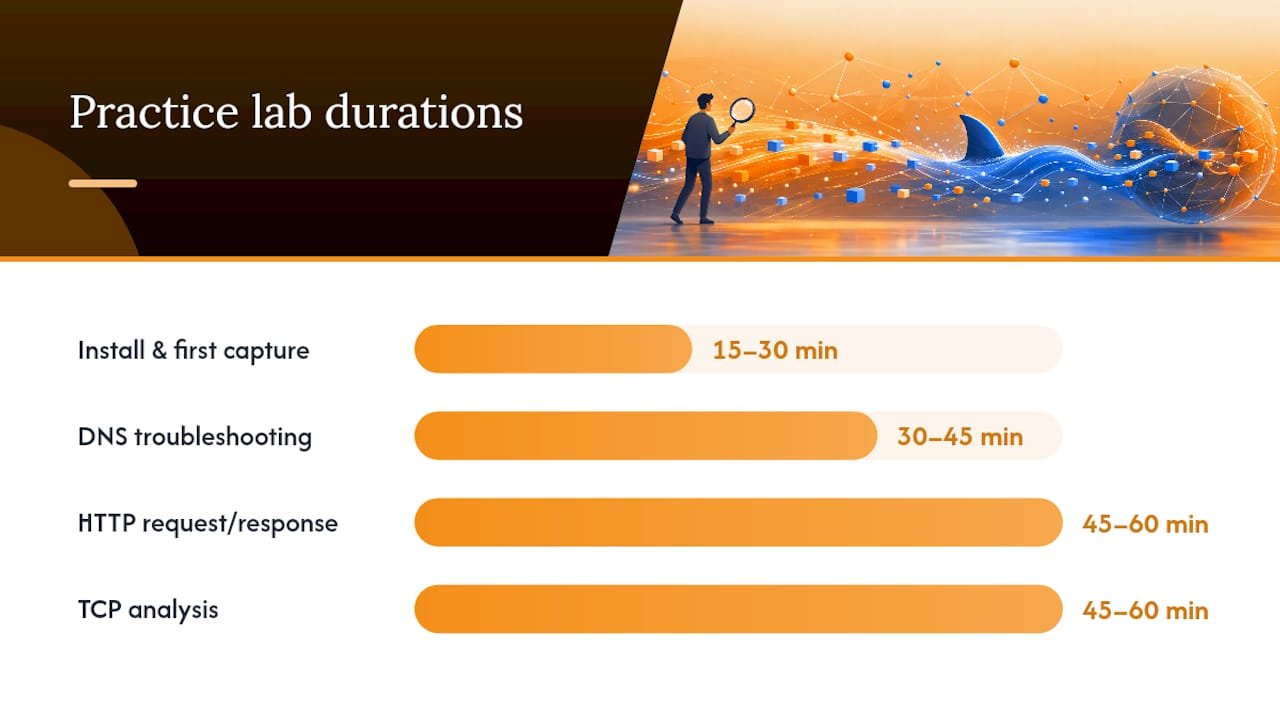
Working through a structured sequence of short labs builds proficiency faster than reading documentation alone. Each lab below maps to a specific skill from earlier sections and includes a success criterion so you know when you have actually completed it.
-
Install and first capture (15–30 minutes). Install Wireshark, select the active interface, start a capture, open a browser and load any website, stop the capture, and save the file as
.pcapng. Success criterion: the saved file opens and shows DNS and TCP packets. -
DNS troubleshooting lab (30–45 minutes). Open the capture from Lab 1, apply the display filter
dns, and locate the query and response for the site you visited. Verify the response contains an IP address. Then run a new capture with the capture filterport 53and repeat. Success criterion: you can identify the DNS query, the response, and the resolved IP address. -
HTTP request/response lab (45–60 minutes). Start a new capture, visit an HTTP (not HTTPS) site or a local test server, stop the capture, apply
http.request, and use Follow TCP Stream to read the full request and response. Success criterion: you can read the HTTP method, host header, status code, and response body in the stream view. -
TCP analysis lab (45–60 minutes). Open any capture containing TCP traffic, apply
tcp.analysis.retransmission, and note which hosts are involved. Then open Conversations and sort by packets to find the busiest flow. Success criterion: you can identify at least one retransmission and explain which host sent it. -
Statistics and top-talkers lab (30 minutes). Open a capture, navigate to Statistics → Protocol Hierarchy, Endpoints, and Conversations in sequence. Identify the top-talking IP address and the dominant protocol. Success criterion: you can name the top talker, its byte total, and the primary protocol in the capture.
After completing these labs, at-home audits using Wireshark alongside a basic cybersecurity audit checklist reinforce the skills in a realistic context. CTF competitions frequently include packet analysis challenges that test exactly these skills under time pressure. When self-directed labs start to feel repetitive, instructor-led training provides curated scenarios and direct feedback that accelerates the transition from practice to job-ready proficiency.
Pairing Wireshark practice with solid networking fundamentals — TCP/IP addressing, subnetting, DNS, and port conventions — makes the packets you capture far more interpretable. A free cybersecurity awareness certification is also a low-barrier credential that signals professional seriousness while you build deeper technical skills.
Why Wireshark is the career skill most beginners underestimate
There is a persistent assumption in entry-level cybersecurity training that Wireshark is an advanced tool, something to learn after certifications are in hand. That assumption gets the sequence backwards. Packet-level visibility is not a specialization; it is the foundation that makes every other network and security concept concrete. When you can watch a TCP handshake complete in real time, the three-way handshake stops being a diagram in a textbook and becomes something you have actually seen.
For career changers and veterans entering cybersecurity, Wireshark practice does something certifications alone cannot: it builds the diagnostic instinct that interviewers probe for when they ask how you would troubleshoot a connectivity issue or investigate suspicious traffic. Knowing the theory is table stakes. Demonstrating that you have run captures, applied filters, and followed streams to a conclusion is what separates candidates.
The practical path matters more than the tool itself. Pair Wireshark sessions with networking fundamentals, specifically TCP/IP, DNS, and port conventions, and the packets you capture become readable almost immediately. Add a structured lab sequence, and within a few weeks you have a portfolio of documented captures that you can reference in interviews. Instructor-led labs accelerate this because a good instructor does not just show you what to click; they give you a scenario with an intentional fault and make you find it. That diagnostic pressure is what builds real proficiency.
Hands-on labs that accelerate your Wireshark learning curve
Wireshark proficiency comes from repetition with feedback, and that is precisely where self-study has a ceiling. Totalcyber’s hands-on cybersecurity training is built around guided captures, curated lab scenarios, and instructor feedback on technique, exactly the structure that shortens the gap between “I’ve read the documentation” and “I can actually diagnose this.”

For career changers and veterans mapping their next steps, Totalcyber’s programs align directly with CompTIA Network+ and Security+ objectives, both of which test packet analysis and network troubleshooting concepts that Wireshark practice reinforces. The career changer cybersecurity roadmap lays out the full sequence from foundational skills to certification-ready lab work. If you are ready to move from self-directed practice to a structured program with live mentoring and exam preparation, review the beginner’s career guide to find the right starting point for your background.
Sources
The following official resources are the most reliable references for deepening your Wireshark knowledge beyond this guide.